
-

Radiowave scattering structure in the disturbed auroral ionosphere : some measured properties
Edward J. Fremouw
A technique for quantitative description of radiowave scattering structure in the disturbed auroral ionosphere is developed in this work. Application is made by means of multi-spacing interferometric observations of a radio star. The work is based on the observed fact that sufficient scattering causes a measurable decrease in correlation of output voltages from neighboring antennas. Such correlation decreases are called visibility fades herein and have been called long-duration fades and radio-star fadeouts by other workers. Random noise theory is employed, and it is assumed that the angular spectrum of the source, as received at the ground after scattering, is randomly phased. However, the usual assumption of a Gaussian autocorrelation function to describe the scattering structure is circumvented, and provision is made for the existence of quasi-periodic structure. Further, the usual assumption of weak (single) or strong (multiple) scatter is avoided. The statistical characteristics of amplitude, phase, and complex signal are developed for the general case of arbitrary degree of scatter, using a numerical method. The technique is applied to observations with phase-switch and phase-sweep interferometers, yielding two important parameters of the received wavefront, the coherence ratio and the wavefront auto-correlation function. The coherence ratio is defined as the ratio of nonscattered to scattered flux received from the source. The wavefront autocorrelation function is defined as the spatial autocorrelation function of the scattered portion of the (complex) wavefront. Two quantities which describe the ionospheric scattering region are obtained from the coherence ratio and wavefront autocorrelation function. First, the optical depth of the region (considered as a purely scattering medium) is determined from the coherence ratio. Second, the ionospheric structural autocorrelation function is established jointly from the wavefront autocorrelation function and the optical depth, yielding a statistical description of the average size and idealized shape of the ion-density irregularities which produced the scattering. Forty-nine visibility fades observed at College, Alaska, between November of 1964 and February of 1966, inclusive, are analyzed. A majority of the fades revealed optical depths in excess of unity at 68 MHz. Optical depth is numerically equal to mean-square fluctuation in radio-frequency phase across a plane at the base of the scattering region, so the fades were characterized by rms phase deviations in excess of one radian at 68 MHz. An approximately inverse-square dependence of optical depth on frequency was obtained from simultaneous observations at 68, 137, and 223 MHz. At 68 MHz, tri-spacing observations were carried out on east-west baselines of 110 meters (25 λ), 220 meters (50 λ), and 330 meters (75 λ). The observations seldom were consistent with the demands of a Gaussian autocorrelation function, as is commonly assumed. Rather, the disturbed auroral ionosphere displays evidence of quasi-periodic structure in the dimensional range of tens and hundreds of meters. The structure observed is comparable in size to auroral rays. While most of the observations were consistent with the assumption of a randomly phased angular spectrum, a significant minority was not. Quantitative results could not be obtained in these instances, and they imply the existence of highly developed quasi-periodicity. Theoretical work is needed to bridge the gap between quasi-periodic structure in the sense of random-noise theory and strict periodicity. Narrow-beam photometers were mounted on one of the interferometer antennas tracking the radio star. Auroral luminosity was recorded along the line of sight during 100% of the visibility fades which occurred at night under clear-sky conditions and during many night-time fades which occurred under cloudy conditions Thus, VHF radio-star visibility fades in the auroral zone result from scattering by irregularities directly associated with auroral forms, at least at night.
-

Sea ice strength
H. R. Peyton
This report contains the results from a study of the mechanical and structural properties of sea ice; the study commenced in 1958 and was completed in late 1965. Most of the experimental work is based upon stress-strain tests in both direct compression and direct tension. Approximately 3800 of these tests were made. Those parameters anticipated to have significant effect upon strength were measured: temperature, salinity, rate of loading, crystal size, crystallographic orientation, history of the ice and depth in the ice sheet. All of these are found to be significant except that the history factor itself tended to be determined by the other parameters. The analysis was accomplished primarily by the testing of models by linear multiple regression. The models selected yield good results with multiple correlation coefficients between 0.70 and 0.98 over a range of petrofabric types. Sea ice is shown to be complex and its description requires five classifications of petrofabric types, each of which exhibit somewhat different characteristics. The load rate proved to be a highly significant parameter in both strength and stiffness in most cases. Ice failing in tension is somewhat less sensitive to load rate than is ice in compression. The interrelated effects of salinity and temperature were studied using the brine volume concept. This study yielded positive confirmation of the brine volume concept, evidence of solid salt reinforcement, and evidence of failure plane selectivity to bypass strongly reinforced planes. These aspects pertain to both tension and compression failure modes. Depth in the ice sheet is shown to be a strength factor when related to each of three parameters; rate of loading, brine volume and solid salt reinforcement. Additional work accomplished in conjunction with construction of large offshore oil drilling platforms had provided significant information concerning oscillatory failure of sea ice in compression and strength reduction at very high load rates. The ice failure force oscillation is an ice property and is not primarily a function of the response of the structure. The amplitude of oscillation is large and at a frequency in the range of most space frame structures. The failing ice may cause forced resonant vibration in structures, and the forces are large enough to resonantly vibrate structure weighing several thousand tons.
-

Scale changing and spectral analysis of analog chart records
Eugene M. Wescott
Data which are contained only in the form of a trace on a strip chart record or on film often may not be fully utilized because of the time and difficulty required for conversion to other forms for analysis. A device is described herein for manually trace following chart records to produce an electrical analog signal. The output signal may be recorded on a strip chart to produce desired amplitude or time scale changes. Time variations of spectral content may be measured by recording the output on a slow speed tape recorder—then speeding up the playback for sonograph analysis. These techniques have been found useful for rapid and inexpensive analysis of analog chart records such as magnetograms.
-

Tracking the aurora by a multifrequency HF backscatter sounder
H. F. Bates, A. E. Belon, G. J. Romick, and W. J. Stringer
A comparison of simultaneous optical and radio auroral data obtained during 12 days in December, 1964, shows conclusively that the radio wave scattering belt includes the visual auroral belt. The optical data were obtained with the Alaskan network of all-sky-cameras located between 65 and 80° north geomagnetic latitude. With the exception of vertical incidence, meteor, groundscatter, and slant F (polar spur) traces, all of the recorded backscatter traces from the north were scaled indiscriminately for slant range. The excellent agreement that resulted leads us to conclude that the majority of the HF and low VHF backscatter echoes observed at high latitudes are auroral echoes in the strict sense of the term. In the records shown the auroral belt was tracked from 65 to above 80°N geomagnetic latitude. It is concluded that the multifrequency HF backscatter sounder makes year-round observations of the auroral belt possible.
-

The determination of the diurnal variation of the auroral belt by radio means
Howard F. Bates
Backscatter echoes in the high frequency portion of the radio spectrum exhibit a systematic southward movement in the evening and northward in the morning. Typically, the scattering belt lies about 78°N geomagnetic latitude during the day, and moves south to 65 to 70° at night. The extent of the southward movement correlates strongly with geomagnetic activity and, to a lesser degree, local time. No significant difference was found between summer and winter diurnal variations of the scattering belt. The scattering belt has been found to include the optical auroral belt; thus, it is concluded that there is no significant difference in the diurnal variation in the position of the summer and winter auroral belts for given levels of magnetic disturbance. The scattering belt was present on the College magnetic meridian during most of the two and one-half years’ observations. This is interpreted as showing the optical auroral belt existed most of the time somewhere on the College meridian, and hence on others as well. Thus, the auroral belt during the solar activity minimum period existed as a more or less closed curve around the geomagnetic pole. When the latitudinal effects are considered versus local time, the auroral belt takes the form of an oval curve, the northernmost portion approximately on the noon meridian. The size of the oval at any time is proportional to the size of the disturbance. The scattering belts as determined from simultaneous College and Thule backscatter soundings over approximately reciprocal paths generally coincided. This result shows that simultaneous soundings in four to eight directions from the magnetic pole could be used to map the auroral belt completely around the earth at any given time.
-

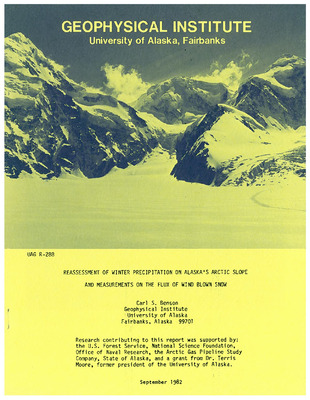
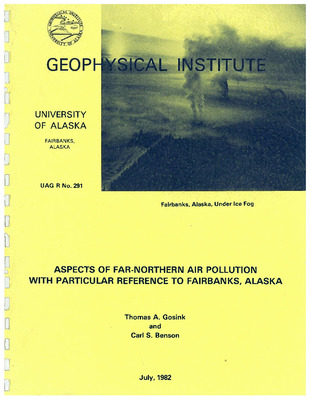
Ice Fog: Low Temperature Air Pollution; Defined with Fairbanks, Alaska as type locality
Carl S. Benson
Stable pressure systems over interior Alaska sometimes produce prolonged, extreme (below -40°C) cold spells at the surface. The meteorological conditions responsible for two such cold spells are discussed in detail in Appendix A, where it is shown that the rate of radiative cooling of the air is enhanced by suspended ice crystals which are themselves a result of the initial cooling. Radiation fogs formed during the onset of cold spells are generally of short duration because the air soon becomes desiccated. These fogs consist of supercooled water droplets until the air temperature goes below the "spontaneous freezing point” for water droplets (about -40°C); the fog then becomes an ice crystal fog, or simply "Ice Fog". During the cooling cycle water is gradually condensed out of the air until the droplets freeze. At this point there is a sharp, discontinuous decrease in the saturation vapor pressure of the air because it must be reckoned over ice rather than over water. The polluted air over Fairbanks allows droplets to begin freezing at the relatively high temperature of -35°C. Between -35 and -40°C the amount of water vapor condensed by freezing of supercooled water droplets is 3 to 5 times greater than the amount condensed by 1°C of cooling at these temperatures. This results in rapid and widespread formation of ice fog (Appendix B) which persists in the Fairbanks area as long as the cold spell lasts. The persistence of Fairbanks ice fog depends on a continual source of moisture (4.1 x 10⁶ Kg H₂O per day) from human activities within the fog. Ice fog crystals are an order of magnitude smaller than diamond dust, or cirrus cloud crystals, which in turn are an order of magnitude smaller than common snow crystals (0.01, 0.1 and 1 to 5-mm respectively). The differences in size are shown to result from differences in cooling rates over 5 orders of magnitude. Most of the ice fog crystals have settling rates which are slower than the upward velocity of air over the city center. The upward air movement is caused by convection cells driven by the 6°C "heat island" over Fairbanks. This causes a reduced precipitation rate which permits the density of ice fog in the city center to be three times greater than that in the outlying areas. The inversions which occur during cold spells over Fairbanks begin at ground level and are among the strongest and most persistent in the world. They are three times stronger than those in the inversion layer over Los Angeles. Thus, the low-lying air over Fairbanks stagnates and becomes effectively decoupled from the atmosphere above, permitting high concentrations of all pollutants. The combustion of fuel oil, gasoline, and coal provides daily inputs of: 4.1 x 10⁶ kg CO₂ ; 8.6 x 10³ kg SO₂ ; and 60, 46 and 20 kg of Pb, Br and Cl respectively, into a lens-like layer of air resting on the surface with a total volume less than 3 x 10⁹ m³. The air pollution over Fairbanks during cold spells couldn't be worse, because the mechanisms for cleaning the air are virtually eliminated while all activities which pollute the air are increased.
-

Dynamo action in the ionosphere and motions of the magnetospheric plasma
Ronald N. DeWitt
This thesis presents a study of the dynamic interaction which takes place between the magnetospheric plasma and the underlying neutral atmosphere; it is hoped thus to gain a better understanding of the effects of this interaction upon the steady state configuration of the magnetosphere. The neutral portion of the atmosphere (the neutrosphere) and the overlying ionized regions (the upper atmosphere and magnetosphere) may be regarded as two distinct dynamic domains that interact in a region of transition occurring between 100 and 150 km over the earth. The neutrosphere because of its greater mass will dominate the motion, and the magnetospheric plasma can be expected to undergo motions related to those of the upper neutrosphere and transition region. However, the geomagnetic field restricts the motion of the magnetospheric plasma to a particular class, allowing one to consider the magnetospheric motion to be constrained. Motions in the transition region of the class not permitted the magnetospheric plasma will give rise to forces against the constraint. The reaction of the constraint on the atmosphere of the transition region takes the form of a Lorentz force J x B where J is the current responsible for the well known solar quiet day daily magnetic variation (Sq). The explanation for the production of this current in the transition region has traditionally been presented in terms of a dynamo-like electromotive force generated by motions of the conducting atmosphere through the magnetic field, whence the transition region is aptly named the dynamo region. The Lorentz force represented by this current constitutes a significant term in the equation of motion for the dynamo region. Another important term arises from eddy viscous stresses immediately below the dynamo region. The equation of motion for the dynamo region must thus include such forces as well as the pressure gradient and Coriolis terms. However, our almost total ignorance of the eddy viscous stress field at the lower surface of the dynamo layer at present precludes our deducing the entire dynamo layer winds from the observed Sq magnetic variation. The kinematics of the dynamo layer are discussed and the motion or the dynamo layer is divided into a symmetric and an antisymmetric part. The term symmetric is here used to describe winds in the northern and southern hemisphere that are the mirror images of each other with respect to the equatorial plane. It is demonstrated that the symmetric component gives rise to electrostatic fields transverse to the field lines, but to no currents along the field lines, while the antisymmetric case produces the converse effects. The symmetric and antisymmetric winds are further divided into components according to the horizontal electromotive force they produce. (a) Symmetric Wind. In the case of the symmetric wind, only the portion of the wind producing the solenoidal component of the horizontal dynamo electromotive force is effective in producing ionospheric currents. It is demonstrated that only this current producing wind system acts against the constraints imposed by the geomagnetic field on magnetospheric motions. The motion of the magnetospheric plasma driven by each such wind system is discussed. The earlier treatments of the dynamo theory consider the dynamo region to be a single layer in which the wind system and the electric conductivity are assumed to be uniform in height. A new, more general derivation of the layer's dynamo action is given in which no restrictions are placed upon the vertical distributions. An effective wind is defined which permits the use of the earlier equations relating the current function, the electrostatic field, and the scalar field describing the current producing part of the effective wind. The equation relating the electrostatic field and the current function is essentially that employed by Maeda (1956), allowing his solution for the portion of the electrostatic field associated with the current producing wind to remain unaffected by the stratification of the wind system. Mathematical techniques for solving the dynamo equations for the electrostatic field are developed. These allow for a quite general conductivity distribution over the globe, only requiring that it be expressible in surface harmonics. The effect of undetected zonal currents upon the solution for the electrostatic field is discussed. It is suggested that a considerable diurnal component of electrostatic field and other components as well may be hidden from us by our inability to detect the prevailing magnetic perturbations produced by zonal currents. The electrostatic field associated with the non-current producing components of the symmetric wind is likewise hidden from us. (b) Antisymmetric Wind. The equations for the current driven by the antisymmetric component of wind are derived, and some of the effects of such currents are discussed. It is found that the conduction of current along the field lines from one hemisphere to the other is associated with an interhemispheric stress between geomagnetically conjugate points of order 3 x 10⁻⁷ newtons/meter². In addition it is found that an antisymmetric layer current density of 5 amperes/km into the polar cap region (across the 75° latitude circle) might give rise to a displacement of about 150 km in the relative position of the conjugate points defined by field lines of the magnetospheric tail. It is suggested that the dynamo action in the 100 to 150 km height plays a role in determining the manner in which the magnetosphere divides itself into the corotating region and the magnetospheric tail.
-

Noctilucent clouds : a survey with special reference to recent observations
Benson Fogle, Sydney Chapman, and Carol Echols
-

College step sounding equipment, recording systems, and operating parameters from 1963 to 1965
Arthur E. Goddard and Howard F. Bates
-

Effective recombination coefficient in D-region
R. Parthasarathy and D. B. Rai
The effect of the meteoric dust particles on the steady state distribution of electrons and ions in the lower ionosphere (50-90 km) has been investigated. It is shown that the effective recombination coefficient obtained is higher than that obtained by ignoring the presence of dust. (Abstract excerpt.)
-

An interpretation of the auroral breakup
Daniel W. Swift
A dynamical model of the magnetosphere is presented to account for the main morphological features of the aurora, and the auroral breakup in particular. The aurora is the result of an internal process in the magnetosphere. It is suggested that a fluting instability on the outer boundary of the ring current belt is responsible for auroral breakup. This instability leads to a rapid flow of the ring current plasma into the tail of the magnetosphere. Particular attention is focused on the mechanisms for energizing electrons, the dynamics of the fluting instability in the magnetosphere including the dissipative effects of the ionosphere, and the structure of the ring current belt. It is stressed that the aurora gets its energy from the DR (ring current) belt. It is shown that the asymmetry of the DR belt and the observed asymmetry of the radiation belts can be accounted for by the asymmetric injection of charged particles on the day side of the geomagnetic field.
-

A new classification of geomagnetic storms and their source flares
Sekiko Yoshida
Geomagnetic storms which occurred between 1956 and 1963 are classified in terms of different combinations of the three basic storm fields, the DCF, DR and DP fields. For each storm, a new attempt is made to identify the source solar flare, based on several new important findings on characteristics of geomagnetic storms.
-

High latitude VLF propagation
Howard F. Bates and Paul R. Albee
This report contains the results of our VLF program which started in 1961. One year’s data obtained in 1963 using a rubidium vapor oscillator as the College frequency standard forms the major part of the data discussed. The VLF variations, primarily perturbations of the phase of the signal, are divided into two categories, 1) those effects known to have been associated with a particular type of event, and 2) those which occur regularly with no apparent connections to geophysical events of a disturbance nature. The first category contains VLF phase anomalies produced by solar flare x-rays, solar flare cosmic rays (these produce the polar cap disturbance, PCD), solar eclipses, and nuclear explosions. Solar flare x-rays produce large amounts of D region ionization. The probability that a given flare produces a VLF sudden phase anomaly (SPA) varies linearly with the optical area of the flare. The SPA magnitude depends upon path length and solar zenith angle, but other factors which have not been determined also enter in strongly. Time differences of a minute or more are observed between SPA onsets on different frequencies over the same path, or over different paths. The SPA decay rate is exponential on long paths, and the lower frequency signal over a given path appears to recover faster. This is consistent with the notion that the lower frequency is reflected lower in the ionosphere. Polar cap disturbances (PCD), produced by low energy cosmic rays, are readily detectable on transpolar VLF signals. Of seven small PCD events since November 1961, we observed four of the five which occurred when our equipment was operating. The polar D region was depressed greatly during this period, even during darkness, and took several days to recover in all the cases noted. The PCD effects were very widespread, undoubtedly covering the entire polar cap. A large scale electron precipitation between the latitudes of 40 and 60 degrees, geomagnetic, on October 1, 1961, produced a markedly abnormal diurnal phase shift on the NBA-College signal. Similar precipitation data is not available for other times so we are not sure that all such abnormal diurnal phase traces can be attributed to widespread particle precipitations. The July 20, 1963, solar eclipse produced a phase retardation that was roughly proportional to the obscured area of the sun as averaged over each VLF path. At first and fourth contact the phase appeared to be decreased. Small phase perturbations were superimposed on the phase anomaly. These appear to be the result of mode interference at the point of totality. Nuclear tests of sufficient yield and altitude produce a definite ‘signature’ on VLF records for paths sufficiently close to the burst. The phase records obtained during the US and USSR high altitude tests of 1962 are shown and discussed briefly. Under the second category we include the regularly-occurring phase anomalies, occurring primarily at night, which are observed at College. Evidence that these variations are the result of phase interference is presented. Using an analysis of the sunrise pattern, we show that second mode energy must normally propagate strongly to 5,000 km and significantly to well over 8,000 km at night. The variations we observed in the VLF phase and amplitude are consistent only with the notion of wave interference. The production mechanism of the phase variations for each propagating mode is still unknown. The phase variations appear to be produced in a relatively small region of the ionosphere; therefore, height changes cannot produce the effects we see. We propose a model in which appreciable mode conversion or coupling between ordinarily independently propagating waves occurs at some sort of D region disturbance. Such coupling appears to be the mechanism for the production of the sunrise-sunset pattern; in that case mode conversion takes place near the sun line in the D region. We suggest that gradients similar to those produced by the sun line might be produced by travelling ionospheric disturbances. The interference between waves produced by coupling at such disturbance lines and those normally propagating could easily produce the large phase changes we observe. This mechanism does not require widespread changes in the D region height, and is therefore in agreement with observations. Some events do produce widespread D region height changes so this mechanism is not being suggested to explain all VLF variations. No significant statistical relationship between geomagnetic disturbances and VLF phase variations was found. A discussion of the present theories about magnetic disturbances shows that none would be expected if no data selection process is used. Our finding is therefore reasonable, in spite of the reports of connections between VLF and geomagnetic effects. Mode interference at great distances greatly complicates the use of VLF signals for ionospheric research purposes. We conclude that the long-distance VLF method is a good detection system for certain events such as cosmic-ray flares, solar-flare-induced ionospheric disturbances, and high altitude nuclear explosions. It cannot presently be used to determine quantitatively the properties of the upper atmosphere or of the various D region disturbance phenomena, so, by itself, it is not a good research tool. In conjunction with other methods it is quite useful.
-

College oblique ionograms
Howard F. Bates and Arthur Goddard
This report illustrates some of the typical backscatter echoes observed at College, Alaska. Backscatter soundings are being made in five directions—015, 105, 210, 270 and 325 degrees true bearing. The majority of the echoes seen were not groundscatter as usually defined. Many echoes from the northern directions were, in fact, direct scatter echoes from the ionosphere. Groundscatter echoes were regularly observed from the south during this past winter, but only rarely from the north. Sample forward oblique ionograms recorded over the Andöya, Norway, to College, Alaska, path are shown. Preliminary results indicate that the signals were primarily propagated via E or Es layers. Signals with delays of 3 to 10 milliseconds over the great-circle path delay were quite common on all the paths monitored at College. The sample records shown contain signals with delays of 4 to 5 milliseconds.
-

Latitudinal and seasonal variations in the night airglow
T. Neil Davis and L. L. Smith
A four-color turret photometer has been used for shipboard observations of the night airglow and the aurora. Zenith observations have been obtained during 1962 close to the 70° W meridian from the northern auroral zone to the Antarctic pack ice. Most of the observations were taken during the Southern Hemisphere Winter. Maximums in the [0I] 5577 Å intensity were found near 30-40° N and 40° S, with the Southern Hemisphere level being generally lower than that in the Northern Hemisphere. The [0I] 6300Å latitudinal variation was similar to that of 0Iλ 5577Å except that maximums in the latitudinal distribution were found near 15° geomagnetic north and south latitudes. In contrast with the [0I] emissions, the sodium group (NaD doublet and OH bands near 5893Å) generally increased to the south with maximums near 20-30° N and 40-50° S geographic latitude. The total 5340Å background increased from north to south. When the integrated starlight and zodiacal light components were subtracted from the total background, the resultant terrestrial component showed a pronounced minimum at low latitudes and apparent symmetry about the geomagnetic equator.
-

A report of activities concerned with the eclipse of 20 July 1963
C. T. Elvey, C. S. Deehr, R. D. Hunsucker, H. F. Bates, and Yoshio Kato
-

An investigation of solar induced phenomena at magnetically conjugate points
Eugene M. Wescott and Keith Benson Mather
The results of a comprehensive study of solar induced geophysical phenomena at pairs of stations linked by a magnetic field line are presented. Studies have established that magnetic variations (except Sq), telluric currents, ionospheric absorption, visual auroras, VLF and ELF emissions and auroral X-rays occur in similar manner in conjugate areas—in time, form and amplitude. The variations of the magnetic field were the most thoroughly studied phenomena. It was found that auroral zone electrojets occur in conjugate patterns, and that a conjugate area, elongated in geomagnetic latitude, can be defined by comparisons of magnetic records. This conjugate area appears to move in time, as the electrojets depart somewhat from conjugate patterns. The magnetic variations at mid and low latitude due to the return current paths of the electrojets are conjugate to approximately the same degree as the ‘primary’ auroral zone activity. At very high latitudes there is a diurnal variation in the degree of correlation at conjugate points—probably due to the distortion of the magnetic field by the solar wind. Some evidence is presented for two kinds of very high latitude magnetic disturbance. One occurring on the night side is probably due to the poleward expansion of auroral electrojet systems. The other occurs on the day side, even on very quiet days, and is possibly due to hydromagnetic waves, produced by the interaction of the magnetosphere surface and the solar wind. This dayside agitation shows inferior correlation. The Sq variation was investigated and found to be a non-conjugate phenomenon. The theoretical effects of field line linkage are found to skew rather than to equalize the variations from a conjugate pattern. The close relationship of telluric currents to magnetic variations, and the effects of local conductivity are considered. Comparison of records from paired stations confirm that telluric currents are conjugate. The mechanism of short period (~ 1 minute) oscillations may be found in modes of oscillation of the magnetosphere, as apart from ionospheric current systems. A pronounced diurnal variation was found in the power spectra and the polarization of short period oscillations at a mid-latitude pair. Comparisons of all-sky camera data from several conjugate pairs confirm that auroras occur in similar, simultaneous displays in conjugate areas. Occasional differences between the northern and southern displays were observed, similar to the anomalies in the magnetic variations. An attempt was made to study the conjugacy of radio auroras at 50-55 Mc/s but the results were inconclusive. Ionospheric absorption of cosmic radio noise—a phenomenon closely related to influx of charged particles and X-rays—has been shown in several studies to occur as a conjugate phenomenon. A conjugate area, similar in shape to that defined by correlation of magnetic variations was found for absorption events. Although no new work was carried out, the published results of conjugate studies of VLF (whistlers, etc.), ELF (micropulsations) and auroral zone balloon flights (auroral zone X-rays) are presented and discussed.
-

The spatial and temporal variations in high latitude cosmic noise absorption and their relation to luminous aurora
Ziauddin Ahmad Ansari
The spatial and temporal variations in cosmic radio noise absorption were investigated at College, Alaska, during 1962-1963 by means of riometers using one narrow beam antenna and two relatively broad beam antennas which were pointed at different direction along the magnetic meridian. The narrow beam antenna had a 12° beamwidth and was periodically swung in the magnetic meridian from 12° north of zenith to 12° south of zenith. Each of the broad beam antennas had a 26° beamwidth and was directed to 40° from zenith, one to the south and the other to the north. In order to explore the relation of the spatial variations in absorption with the differences in auroral luminosity existing in different directions at a given time, two λ 5577A photometers were operated in the two switching directions of the narrow bean antenna i.e. 12°N and 12°S. The information about the auroral coverage of the various antenna beams was obtained from all-sky photographs. A simultaneous study of radio-wave absorption in relation to luminous aurora resulted in the conclusion that the nighttime radio-wave absorption observed at College, Alaska falls into the following two main categories. The absorption belonging to Category I is observed at any time between 2000-0200 hrs., correlates well with the intensity fluctuations of λ 5577A, and is limited to luminous regions of the sky only. Included in the above category is the absorption associated with the quiet as well as bright and active phases of the display. The absorption belonging to Category II is observed only in the post-midnight hours, does not correlate with the intensity fluctuations of λ 5577A and, most probably, is not limited to luminous regions of sky only. With the absorption making a transition from Category I to Category II, a 10-100 fold increase takes place in the ration of absorption to λ 5577A intensity. In order to explore the contribution of bremsstrahlung X-rays to the observed absorption of both categories, the X-ray intensity is calculated on top of the D-region assuming reasonable flux values of the primary electrons. Using the results of the generalized magnetoionic theory, it is shown that the contribution of X-rays to the observed absorption is at the most 2¹/₂% and therefore may be safely neglected. The close association between radio-wave absorption and luminous aurora during absorption events of Category I suggests that the primary particles responsible for the absorption are approximately in the energy range 10-20 kev. It is shown that the absorption associated with the quiet phase of the auroral display is easily explained by a flux of 107-108 electrons cm⁻² sec⁻¹ in the above energy range. It is also shown that the transition from the quiet phase to the bright and active phase is the result of a momentary 10-100 fold increase in the flux of low energy electrons. The lack of correlation between absorption and λ 5577A intensity fluctuations and the pronounced increase in the ratio of absorption to λ 5577A intensity observed during absorption events of Category II are indicative of a hardening of the primary particle energy spectrum, possibly due to the injection of a large number of electrons in the energy range 30-100 kev. It is estimated that a flux of 106-107 electron cm⁻² sec⁻¹ in the above energy range can adequately account for the observed absorption. In the light of the above observations, the apparent discrepancy between the results of two rocket flights at Fort Churchill, one by McIlwain and the other by McDiarmid et al, is easily resolved. This work was supported by National Science Foundation, Grants 14133 and 947.
Printing is not supported at the primary Gallery Thumbnail page. Please first navigate to a specific Image before printing.


