
-

Hourly values of the auroral electrojet activity index AE for 1960
Y. S. Wong, Carol Echols, and T. Neil Davis
-

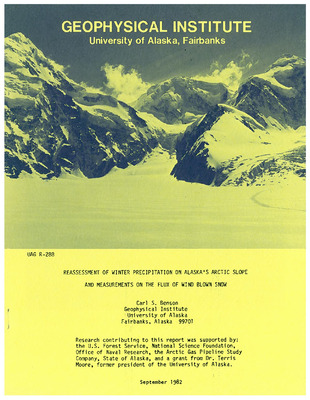
A Reconnaissance Snow Survey of Interior Alaska
Carl S. Benson
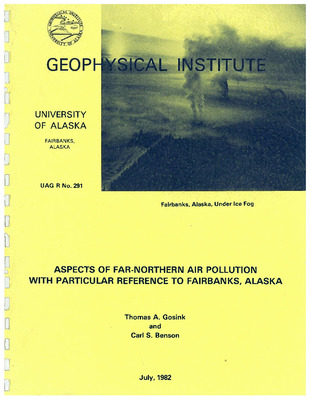
The salient feature of the snow cover in the lowlands of interior Alaska is its low density. This results from prolonged exposure to steep snow temperature gradients with negligible wind action. Strong surface inversions occur frequently and last for weeks at a time in interior Alaska and decouple the lowest air layer in valley bottoms from the air aloft. The dense surface air layer is still and cold (-30 to -40°C is common) and the shallow (less than 1 m thick) snow pack underlying it is subjected to steep temperature gradients because the snow-soil interface temperature rarely goes below -6°C. This transforms most of the snow pack into depth hoar before spring breakup. The density of this depth hoar is generally less than 0.20 g cm-3 which is significantly less than that observed on the Greenland and Antarctic ice sheets or in Alpine snow packs. The boundary between air in the valley bottoms and the air aloft is often sharp. Above the inversion winds are frequent and the snow in this environment is harder and had surface density values in the range of 0.35 to 0.40 g cm-3 whereas the density of the entire snow pack in valley bottoms, only 200-300 m below, is about 0.20 g cm-3. Towns in lowland valleys, such as Fairbanks, lie in the stagnant inversion layer and are subject to air pollution in the winter. The snow cover can be utilized to measure this pollution because it acts as a gigantic filter for fallout particles. A simple measure of impurities in snow is obtained by measuring the specific electrical conductance of its melt water. Tests on a network of top-to-bottom samples of the snow pack taken just before breakup during each of three years, in and around Fairbanks, show values which increase sharply from less than 10 µmho cm-1 in outlying areas to greater than 100 µmho cm-1 downtown. Since this is a reconnaissance study a chronological summary of the field work is presented with the results.
-

The June 21, 1967 earthquake series at Fairbanks, Alaska : aftershock locations, depths and magnitudes
Eduard Berg, Larry Gedney, Susumu Kubota, Ken Hanson, and Jurgen Kienle
Aftershock recordings have been obtained to determine the extent of the fracture area which using some 50 shocks, was found to be an area of 10 x 15 km with the major axis roughly oriented in a NW-SE direction. Hypocenter depth varies from 6 to 19 km, with most of the shocks being confined to a depth of 10 to 13 km. It was found that the Jeffreys-Bullen velocities, Vp = 5.56 and Vs = 3.37 km/sec, represent a close approximation of the velocities in the area. Presented also are the telemeter network readings from June 21, 1800 GMT to July 14. These readings include the aftershocks of magnitude 2.5 and upward.
-

Large aperture seismic telemetering system for central Alaska
Eduard Berg, Norbert Sperlich, and William Feetham
The Geophysical Institute has established and now operates a large aperture seismic telemeter network in Alaska. At present four stations are operated and two more will be added shortly. The system is described in its technical details, including the remote site equipment and the method of recording at the Geophysical Institute. Without the use of methods for improving signal-to-noise ratio (such as velocity and/or frequency filtering) the sensitivity of the seismic stations for detecting distant earthquakes is similar to that of the U.S.C.&G.S. College Observatory. This sensitivity allows recording of earthquakes down to magnitude 4 (U.S.C.&G.S. magnitude) in the 80° distant range. Epicenter maps for three 1-month periods for interior and coastal Alaska are presented.
-

The magnetotelluric coast effect near a dyke or long promontory
J. R. Blake and Daniel W. Swift
The magnetic and telluric fields near a vertical, infinitely deep dyke in an otherwise homogeneous plane medium are calculated. The approximate constancy of the horizontal, surface magnetic field at low frequencies is used as a boundary condition, following Weaver (1963b). Both “polarizations” of the surface electromagnetic field are considered, according to whether the electric or magnetic fields are parallel to the strike. The polarization ellipses of the telluric field and the vertical magnetic field are computed as functions of the conductivity ratio, and dyke thickness, for various observing positions and frequencies, and the fields are compared with similar calculations based on Weaver’s simple fault model. An extension is outlined and the analytical results presented for the case where both ocean and land are underlain by a non-conducting basement. The work of Rankin (1962) is thus extended to cover both polarization orientation of the surface field.
-

Variables involved in descriptions of world-wide auroral morphology
T. Neil Davis
Any aspect of auroral morphology is a function of three spatial and one temporal variable and therefore is difficult to describe adequately on a two dimensional sheet of paper. Emphasis is given here to examination of the variables and fixed parameters employed in descriptions of auroral morphology.
-

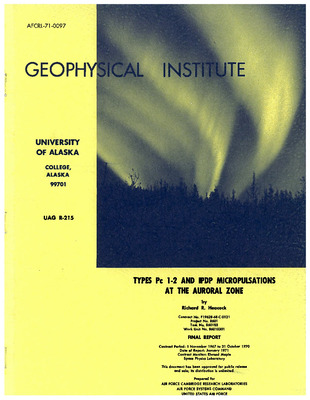
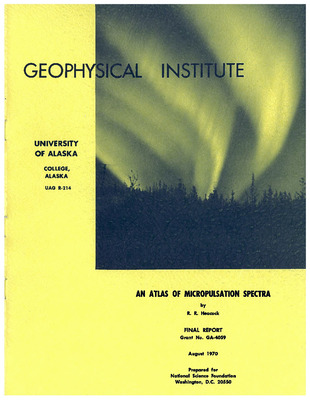
Telluric current micropulsations at the auroral zone
Victor Peter Hessler and Richard R. Heacock
This report presents analysis of individual events and statistical results derived from several years of continuous Pc 1 recording at College, using the telluric current technique. Histograms of occurrence distributions versus Kₚ and versus pulse period, together with sonagrams, justify dividing Pc 1 into two main classes. Class 1 activity has pulse periods mainly shorter than 3 sec, is usually structured, has a pronounced mid-day maximum in occurrence, not much seasonal variation in occurrence, and has little occurrence relationship to Kₚ except for a tendency to be absent when Kₚ is large. Class 2 Pc 1 activity has periods usually longer than 2 sec, is usually unstructured, has a very pronounced afternoon maximum in occurrence at College, a seasonal maximum in summer, and has a positive correlation with Kₚ. Class 1 activity may originate mainly in closed field line regions and Class 2 in open field line regions. Class 1 mid-frequencies tend to rise as Kₚ rises and tend to be higher at night than in the daytime. Average Pc 1 amplitudes maximize in daytime at College as do the occurrences. Thus there is an extreme daytime maximum in summed amplitudes, indicating that the Pc 1 incident energy has a pronounced daytime maximum at College. College sonagrams of Pc 1 events show a great variety of frequency-time forms. Rising frequency periodic structures are most common, but falling frequencies are often seen sometimes superimposed on rising events. At times narrow band “necklaces” are clearly seen. Long duration structured events were observed with durations up to 18 hours. The long events tended to occur only at times of rather low Kₚ.
-

Notes on topographic factors affecting the surface wind in Antarctica, with special reference to katabatic winds ; and bibliography
K. B. Mather and G. S. Miller
The topography of the environs of Antarctic stations plays an important part in determining prevailing surface winds. The stations are variously located near the foot of the plateau slope, on offshore islands, on peninsulas, on extensive rock areas, on ice shelves, at sundry latitudes on the plateau and differing distances from the coast. This report is mainly a collection of notes on the topographic factors likely to influence the surface wind. Thirty-four sites are considered, including those of present stations and former expeditions. Particular attention is paid to plateau slope and the exposure of the site to katabatic drainage. Wind roses are shown for most stations, in relation to the plateau contours. Meteorological and sastrugi observations made on traverses are used to supplement the station data. The poor information available on plateau contours was a major handicap throughout the work. Some classifications and systematics of Antarctic data are tabulated, including seasonal variations of wind speed and temperature, the diurnal variation of wind speed, wind frequency versus wind direction, the deviation of the predominant wind direction from the azimuth of plateau slope, the wind direction near the front of ice shelves, and the mean annual wind speed in relation to temperature. The overall flow pattern of the surface winds of Antarctica is shown. Much of the information contained in the report is presented in the form of 7 tables and 75 maps and figures. A comprehensive bibliography (169 entries) lists source material for the notes on station topography and winds, and articles relating particularly to katabatic winds. The report does not deal with upper winds or the general circulation.
-

Hourly values of the auroral electrojet activity index AE for 1959
Y. S. Wong, Carol Echols, and T. Neil Davis
-

Hourly values of the auroral electrojet activity index AE for 1961
Y. S. Wong, Carol Echols, and T. Neil Davis
-

Computed HF auroral backscatter traces for various distances
Howard F. Bates
Computed ionospheric backscatter traces in the HF portion of the radio spectrum are illustrated for a number of distances between the auroral belt and the observing radar. The type, frequency range, and observed scattering height of HF auroral backscatter traces are strongly dependent upon the ionospheric propagation conditions existing between the auroral belt and the observer. Backscatter echoes produced in a given region of space by a single backscattering mechanism can have completely different range versus frequency characteristics when observed at sites located at different distances from the scattering region. Even though a given bank of auroral-belt irregularities extends through both the E and F regions, it is possible that only E-scatter is detected at one distance, and F-scatter at another. Trace type, scattering height, and frequency range of the observed backscatter echoes are strongly dependent upon the distance between the auroral belt and the observer.
-

Results of the HF forward and backscatter program at College since 1963
Howard F. Bates
This report describes the results of the HF backscatter and forward sounding project conducted at College, Alaska, from 1963 to 1966. The primary finding was that with the exception of slant-F, meteor and groundscatter echoes, the oblique backscatter echoes observed from the auroral zone and polar cap ionospheres were produced by the aurora. When combined with satellite data, this result led to the conclusion that the auroral precipitation markedly increases the electron density at all ionospheric heights, and an auroral model incorporating this notion explains most of the observed details of auroral backscatter, and of auroral sidescatter on forward-oblique paths. The absence of groundscatter from beyond the auroral belt is explained as being due, in part, to the enhanced ionization of the E region by the auroral precipitation. Aspect-sensitive auroral backscatter can be obtained from the south as well as from the north in the northern hemisphere. A single sounder installed at each geomagnetic pole could provide real-time information on the position of the auroral precipitation completely about the pole. Auroral morphology studies made from radio data are independent of the weather and the season. An examination of a year’s data shows that no marked difference exists between the behavior of the summer and winter positions of the auroral precipitation; the northern limit of the south boundary of the aurora during the day was found to be approximately 1.5° geomagnetic latitude north of that during the winter. The radio data for 1965 agrees closely with published optical data for the period of 1957 to 1959 when the level of magnetic activity is considered. This finding shows that the position of the southern boundary of the auroral precipitation for a given level of magnetic activity does not depend appreciably upon the level of solar activity. The excellent correspondence between the optical and radio determinations of the auroral position and occurrence rates is added evidence that the radio method provides reliable auroral tracking information.
-

On the strong influence of the F1 layer on medium to high latitude HF propagation
Howard F. Bates and Paul R. Albee
During the recent sunspot minimum of the F1 layer critical frequency was close to that of the F2 in the medium to high latitudes. This considerably modified HF propagation conditions over long distance paths. At times the F1 layer appeared to block off the propagation of signals in the very oblique F2 modes. High order F2 mode signals were frequently strong and were reflected from large virtual heights. This retardation was produced by the dense, thick F1 layer which existed in the medium to high latitudes during the summer of 1964. The maximum radio frequency for the path was frequently determined by the F1 layer; although this effect has been noted by various workers, it has not been taken into account for communications predictions. One particularly strong and highly delayed type of signal is not readily explainable as a higher order F2 mode because it occurred singly. If it were an ordinary F2 mode trace, its occurrence would lead to the conclusion that the only F2 layer signal propagating was a third or fourth order mode signal on paths of 3500 to 5000 km, and such a conclusion is hard to justify. As an alternative, an F1-F2 ducted mode hypothesis is presented.
-

College step sounding equipment, recording systems, and operating parameters from 1963 to 1965
Howard F. Bates and J. A. Teas
-

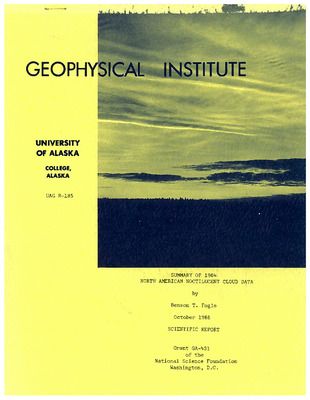
Noctilucent clouds
Benson T. Fogle
This report contains a detailed account of 4 years of experiments and observations on noctilucent clouds (abbreviation: NLC) organized by the author in North America and in the southern hemisphere as well as a comprehensive summary and discussion of the material published by other researchers. (Abstract excerpt).
-

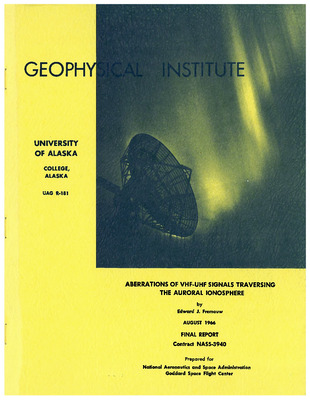
Aberrations of VHF-UHF signals traversing the auroral ionosphere
Edward J. Fremouw
This final report summarizes an investigation of radiowave scattering in the auroral ionosphere, based on observations of radio-star and satellite signals. The observations were carried out near solar minimum and are compared with radio-star observations performed near the previous solar maximum. Results show that 223 MHz scintillations of the radio-star Cassiopeia A declined from the start of the current observations in 1962 through the winter of 1964-65. Subsequently, scintillations on 223 MHz have continuously increased. Observations at 137 MHz, begun in 1965, also have shown continuously increasing scintillation. Both radio-star and satellite scintillations have shown a nighttime maximum and a daytime minimum in their diurnal variations, showing little change from the diurnal pattern found near solar maximum. Satellite scintillation at 136 MHz has shown the statistical center of the scattering zone to be north of Fairbanks, Alaska (geomagnetic latitude, 65°N), during 1965-66. A close relation of severe satellite scatter events and radio-star visibility fades, on the one hand, to visible auroral luminosity, on the other, has been found. In addition, strong refraction of satellite signals has been found to occur near auroral arcs, with angular deviations up to at least 7° being observed at 137 MHz. Quantitative predictions are made regarding the severity of scatter effects to be expected during the next solar maximum on VHF and UHF satellite communications links in the auroral zones.
Printing is not supported at the primary Gallery Thumbnail page. Please first navigate to a specific Image before printing.


